What is a Fishbone Diagram?
A Fishbone diagram, also known as an Ishikawa diagram, is defined as a powerful causal analysis tool designed to uncover the root causes of complex problems. Widely utilized in manufacturing, industrial services, product development, and general troubleshooting, this visual methodology provides a structured approach to identify and address issues with clarity. By visually mapping potential causes, teams can efficiently pinpoint the underlying factors affecting processes and systems. Explore how integrating Fishbone diagrams into your problem-solving toolkit can lead to precise and effective solutions in various industries.
Any fishbone diagram has 3 key components:
- The problem at the head of the fish
- The attributes that form the key function as the bones stemming out from the spine
- The problem areas within the attributes that are the potential causes of the problem on the head.
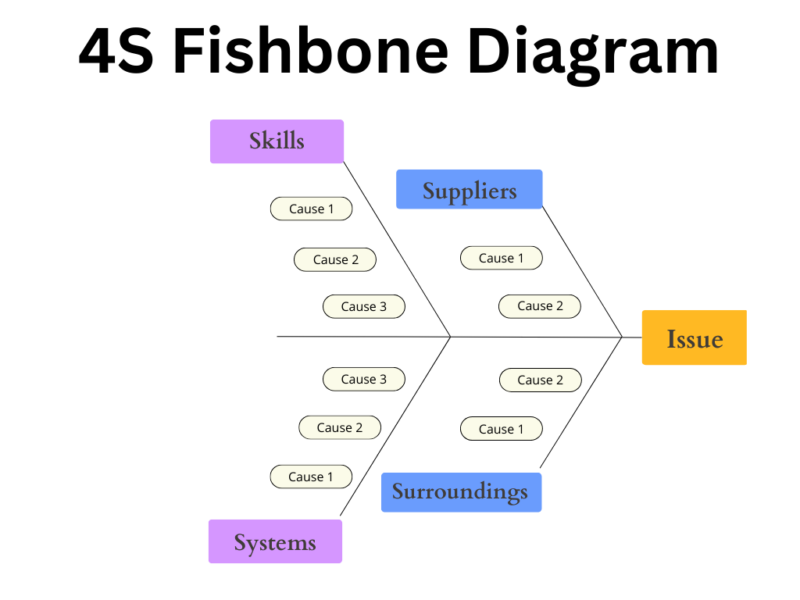
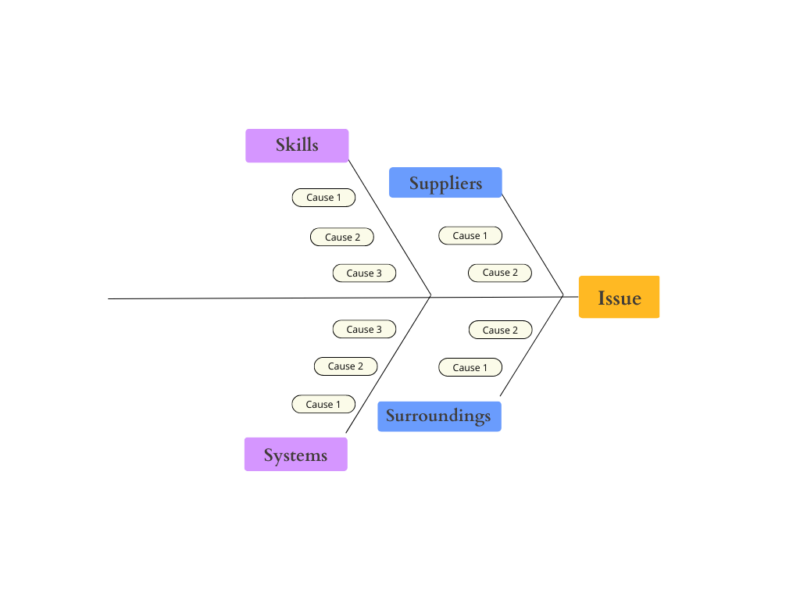
An example of the application of a fishbone diagram will be the typical 4S fishbone used in manufacturing. The 4S’s represent – systems, surroundings, skills, and suppliers. Each ‘s’ factor is accompanied by adjoint ‘bones’ which represent the issues in these attributes of the manufacturing process.
Below is an example of a 4S fishbone diagram:

Importance and Purpose of Fishbone Diagrams
Fishbone diagrams are often seen as a problem-solving tool, but they can also function as an excellent visual aid when issues need to be explained and coordinated with larger teams.
Here are some of the factors that make fishbone diagrams an important business tool:
- Visual problem solving: A fishbone diagram’s key utility comes from the fact that it is visual versus being a list or a spreadsheet. This allows one to expand the diagram to as many attributes and root causes as needed without being overwhelmed by the sheer number of underlying issues. Furthermore, the layout of the diagram allows one to incorporate both internal and external factors during analysis.
- Real problem-solving over treating symptoms: Often brainstorming sessions or company meetings may be spent trying to deal with symptoms of a problem, such as lower sales numbers or employee attrition, without trying to get to the root of the problems. A fishbone diagram starts with the goal of trying to identify the root causes, with the symptoms also getting their place in the diagram. This allows for holistic analysis and problem-solving, where symptoms are not ignored while being cognizant that the root cause needs to be identified to solve the larger problem.
- Easily presentable visual aid: One of the key issues with trying to solve a problem where the root cause or causes have been identified – is explaining this complex structure to company leaders and getting their cooperation. A fishbone diagram layout is a great alternative visual tool to show how multiple contributing factors are together causing the main problem, and how each of these root causes will need to be addressed in order to treat the main issue.
Learn more: 5 Unique Fishbone Diagram Applications
Fishbone Diagrams Categories
Fishbone diagrams use categories or branches to help organize and classify potential causes contributing to a problem. These categories can vary depending on the specific problem you’re addressing, but there are some common categories often used as a starting point. These categories include:
- People: This category encompasses factors related to human resources, such as skills, training, experience, communication, and motivation. Problems related to people might involve insufficient training, lack of teamwork, or individual skill deficiencies.
- Process: Process-related factors pertain to the steps, procedures, and workflows involved in a particular process. This category examines aspects like the sequence of activities, work instructions, workflow inefficiencies, and process variations.
- Equipment: Equipment includes any physical tools, machinery, or technology used in a process. Problems in this category can involve equipment malfunctions, outdated technology, or improper maintenance.
- Materials: Material-related causes address issues with the input materials, components, or supplies used in a process. Problems might arise from substandard materials, inconsistent quality, or inadequate inventory control.
- Environment: The environment category relates to the physical or external conditions where the process occurs. This can encompass factors like temperature, humidity, lighting, and workspace design. For instance, an uncomfortable or poorly lit workspace could impact productivity.
- Measurement: Measurement factors refer to the metrics, data, and key performance indicators (KPIs) used to assess the process or outcome. Problems in this category might include inaccurate data, improper data collection methods, or inadequate metrics for evaluating success.
- Methods: The methods category deals with the specific techniques, procedures, or strategies used in carrying out a process. Problems related to methods could involve outdated techniques, lack of standard operating procedures, or ineffective strategies.
- Management: Management-related causes relate to the leadership and organizational oversight of the process. Issues might arise from poor decision-making, lack of support, or inadequate resource allocation.
- Policies: Policies refer to the rules, regulations, and guidelines governing the process or the organization. Problems related to policies could involve conflicting rules, outdated policies, or overly restrictive guidelines.
- Safety: Safety issues include factors related to the physical safety of personnel, environmental safety, and the safety of products or services. Problems in this category might involve insufficient safety measures, inadequate training, or safety violations.
- Suppliers: Suppliers are external entities or organizations that provide materials, components, or services necessary for the process. Issues may stem from unreliable suppliers, late deliveries, or inconsistent quality of supplied materials.
- Technology: Technology encompasses the software, hardware, and digital tools used in a process. Problems might arise from incompatible software, software bugs, or outdated hardware, which can be addressed through appropriate hardware development services.
These categories serve as a starting point for brainstorming and organizing potential causes, but they can be customized and expanded to suit the specific problem you’re addressing. The goal is to identify all possible causes that could contribute to the problem, making the fishbone diagram a valuable tool for root cause analysis and problem-solving.
Types of Fishbone Diagrams
While the underlying method for any fishbone remains consistent, there are certain types that are widely used and serve as a standard template. Here are the 4 key types of fishbone diagrams commonly used today:
- Simple Fishbone Diagram
A simple fishbone is made up of only 2 attributes with causes attached to the main head representing the main problem to be solved. This diagram is used to solve problems where the causes can be grouped into two attributes. For example, while trying to analyze website traffic, one may choose to divide them into just 2 channels – organic and non-organic sources.
- 4S Fishbone Diagram
The 4S fishbone diagram (example above) is a standard manufacturing and industrial problem-solving tool, however, it can also be used for any product development process, including software development. The 4S of the fishbone represent suppliers (or simply input sources), skills, surroundings (any surrounding factor, including real estate or office space), and systems (including computer systems). The advantage of this diagram is that it limits the attributes to 4 factors while trying to broadly capture all key attributes, which helps focus on the underlying problems without expanding into too many attributes or departments.
- 8P Fishbone Diagram
The 8P fishbone is a typical enterprise fishbone that liberally allows expansion into 8 attributes, namely – price, product, people (employees and shareholders), place (or plant, in case of a physical factory or outlets), promotions (marketing), procedures, policies, and processes.
- 6M Fishbone Diagram
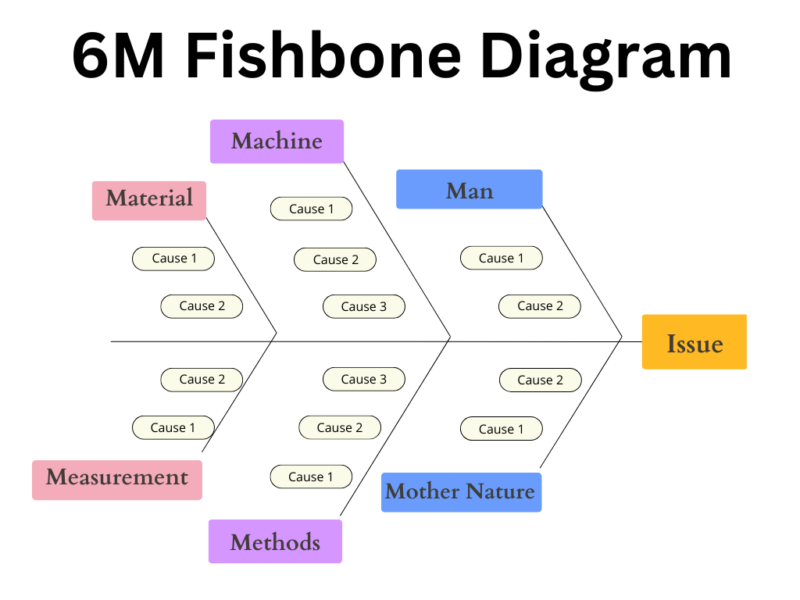
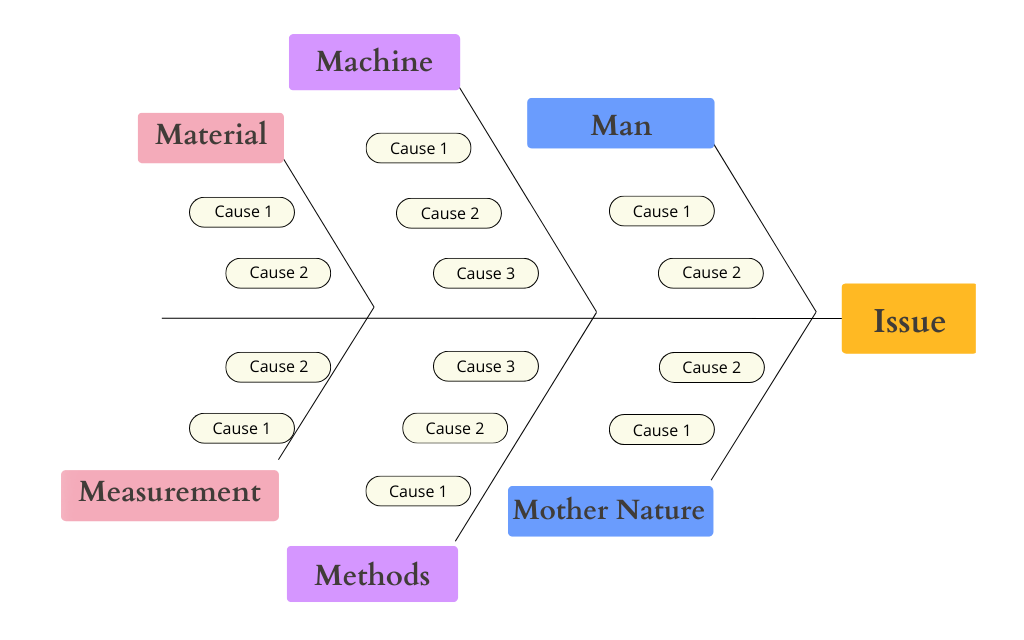
The 6M fishbone is a standard primarily set for manufacturing and rarely used outside of its intended scope. The 6 attributes are the man (human resources), machine (including computer systems and enterprise software stack), measurements (company metrics), materials, method, and mother nature (manufacturing and business environment).
Below is a 6M fishbone diagram example:

How Fishbone Diagrams Examples to Drive Solutions
Here are three insightful examples showcasing their practical applications across diverse industries.
Example 1. Manufacturing Excellence
In the manufacturing sector, Fishbone diagrams are instrumental in addressing production bottlenecks. For instance, consider a scenario where a manufacturing line is experiencing unexpected downtime. By utilizing a Fishbone diagram, teams can systematically explore factors such as equipment malfunctions, process inefficiencies, or human error, leading to targeted solutions and improved operational efficiency.
Example 2. Healthcare Diagnostics
In healthcare, Fishbone diagrams prove invaluable for diagnosing and addressing challenges. Let’s take patient wait times in a hospital as an example. By categorizing potential causes such as staffing issues, scheduling inefficiencies, or communication gaps, healthcare professionals can streamline processes and enhance the overall patient experience.
Example 3. Software Development Hurdles
Even in the realm of software development, Fishbone diagrams find their place. Imagine a project facing delays; a Fishbone diagram can uncover the underlying causes, be it coding errors, communication breakdowns, or resource constraints. This methodical approach allows development teams to rectify issues promptly and ensure project timelines are met.
Integrating Fishbone Diagrams into Your Toolkit
Now that you’ve glimpsed the versatility of Fishbone diagrams through these examples, consider incorporating them into your problem-solving toolkit. Whether you operate in manufacturing, healthcare, software development, or any other industry, the Fishbone diagram offers a structured and visual approach to identifying and addressing challenges head-on.
Explore the possibilities, and empower your teams with this effective problem-solving methodology. The next time a complex issue arises, let the Fishbone diagram be your guide to uncovering root causes and driving impactful solutions.
Learn more: What is a Venn Diagram?
How to Create a Fishbone Diagram: 4 Key Steps
A fishbone diagram can go from being a simple 2 attribute diagram to complex like an 8P diagram or even more.
Here are the key steps to ensuring a successful fishbone diagram for identifying and solving root causes and problems:
- Identify the main problem to solve. This is the key issue around which the attributes will be laid out for the root cause analysis to take place.
- Create a straight line and on the head mention the main problem to be solved. For example, this could be reduced sales, lower factory output, more efficient budget, or poor product quality.
- The next step is to lay out contributing areas or departments, laid out in the form of spokes (or supporting bones) stemming out from the main problem (vertebral column). While laying out the main problem, you can be specific or broad, based on the number of attributes you can reasonably manage. Note that these are the areas that contain processes, people, or resources that may have contributed to the main enterprise problem at the head of the fish.
- Draw out the root issues within the attributes. Be as direct as possible since there are no deeper branches to expand for more details. The branching in a fishbone begins with the central line and ends with the root causes with the attributes in the middle.

Top 5 Best Practices for a Fishbone Diagram in 2023
- Get broad agreement on the core problem
One of the most critical preliminary preparations to do before you even draw the first line of the finebone diagram – is to ensure that you have a broad consensus on the core problem to be solved. Depending on the depth and impact, this may need to include just your manager or expand to company-wide senior management. This consensus will ensure that the right investments are being made towards solving the problem that needs immediate attention in the priority order.
- List down all possible attributes even if you condense them later
We have gone through types of fish bones, where the lowest was just 2 attributes and the highest was 8. However, it is a best practice to ensure that the potential fishbone attributes are listed out without consideration for the number of attributes in the final fishbone. This ensures that during the planning stage, all possible attributes are evaluated for potential issues. Based on understanding, the creator can now condense and group attributes where reasonably possible based on projected causes.
At times, there may be too many causes listed under one attribute as the fishbone begins to be drawn. This situation may be better served by splitting them into more attributes.
- Consult with department leaders and managers for cause-analysis
When it comes to the individual attributes, each needs specialist consultation to fully understand the scope and issues that may be arising. This means discussing the main problem and underlying issues with the company/ team leaders who are responsible for those departments or teams. Often they may come up with the issues alongside recommendations for solving them.
- Involve all stakeholders
It is likely that the problem and/or the solutions will affect other teams. Therefore, while analyzing for the root causes, it is important to include all stakeholders to the extent it is feasible. Depending on the company culture, solutions may get approved by the management and then communicated to other teams, or the management may insist on including other affected teams during the problem-analysis stage.
- Expand to multiple fishbones when needed
There may be cases when either the attributes or the underlying causes become too expansive to cover under one fishbone diagram. At this point, it may be a better idea to use multiple fishbones rather than the same diagram.
Learn more: What is UML Diagram?
Most Recent Posts
Explore the latest innovation insights and trends with our recent blog posts.


