Table of Contents
Using a Venn diagram is one of the most common forms of visual collaboration and is likely something that you’ve done since childhood. Even though it’s a very simple template, it has some serious business applications and can be used to clarify several important scenarios.
In this article, we will define a Venn diagram and talk about some of the professional applications that make it increasingly pertinent to businesses everywhere.
What is a Venn Diagram?
A Venn Diagram is defined as a powerful visual representation consisting of overlapping circles that systematically illustrate shared characteristics between two or more entities. This versatile tool, commonly employed in educational settings to elucidate relationships among concepts, extends its utility to virtual workshops, presentations, and collaborative brainstorming sessions within professional environments. By simplifying complex associations, Venn Diagrams serve as invaluable aids, fostering a deeper understanding of connections and distinctions.
The most common use case for businesses is taking two or more items and analyzing their advantages or disadvantages when compared to each other. Their commonalities and differences can be crucial in determining how compatible they are with your current business plan and with each other. Because of this, Venn diagrams are great templates for problem-solving and brainstorming connections. These exercises will help your business decide what is the correct path forward.
Brief History of Venn Diagrams
Venn diagrams have a long history of use both in the classroom and for businesses and are most widely used in math, statistics, and logic. Their use in multiple areas gives them multiple aliases too. They’re also commonly known as Set diagrams or Logic diagrams. As previously mentioned they’re most commonly found in school due to their basic level of comprehension and simple structure.
While Venn diagrams are very simple at their core, they can be expanded to form very complex relationships and have a unique connection to the mathematical world. The total set of areas in a Venn diagram will always be a prime number, making way for some interesting mathematical properties. Additionally, the relationship that Venn diagrams present is always a logical one, meaning the items will be related directly. This is important because it means there is no extraneous relationships or assumptive connection – everything is 1:1
This dichotomy between very simple templates and more complex structures makes Venn diagrams widely appreciated by many different communities and dates their use back hundreds of years.
Why Venn Diagrams are Important
We’ve already talked about how Venn diagrams work and how they apply to various classroom and business applications, but it can still be a little unclear as to why Venn diagrams are important. After all, they’re just a very basic set of circles, right? Even though they are shockingly simple, this simplicity can be extremely helpful in providing clarity and understanding to students and businesses. Here are some of the biggest advantages of using a Venn diagram.
- Visual Organization
The biggest advantage of using a Venn diagram is its ability to organize information in a simple and understandable format. This allows you to clarify any misaligned information and align it under the proper umbrella.
Being able to organize information in a clear structure is a massive advantage, but the main advantage is the visualization that comes with the organization. Thanks to this diagram you’re able to visualize your data on a board and implement a graphic organization of the information. Being able to visualize ideas and connections is extremely helpful when people are trying to comprehend the connections between items and is a massive boost to people’s understanding of the topic at hand.
People are inherently visual learners, so when this information is displayed on a physical board in front of them, it becomes much easier to pick up, learn, and move forward with that knowledge. Due to the powerful nature of visualization, many teams use Venn diagrams during presentations to get their point across in the most efficient and digestible manner.
- Direct Comparison
When analyzing different items or choices it can be really hard to understand where exactly they overlap and intersect, and sometimes the best way to understand this is to create a physical intersection. This intersection is the entire purpose of a Venn diagram.
When comparing items on a Venn diagram it is incredibly easy to see what they have in common and also what features are unique to each section. This could be important when choosing from different design styles, or maybe when selecting a service provider.
This ability is also commonly used when comparing data, predicting future intersections of products, or as a probability measurement. All of these use cases and more are beneficiaries of the direct comparison that the Venn diagram offers.
- Simplifying Ideas
One of the reasons Venn diagrams are so helpful is that they break down complex relationships into simple, digestible information. By breaking down ideas into their simplest relationships you can gain a better understanding of what they mean and how they relate to one another. Only when seeing things in their barest form can you understand the relationship and move forward.
For both students and professionals, thinking through the logic behind the relationship between items can be helpful when understanding their bearing and importance to the greater concept you’re analyzing. Visually communicating these ideas makes understanding the logic behind their relationships much easier and is a big advantage to teams who use this structure.
Learn more: What is UML Diagram?
Venn Diagram vs Euler Diagram
Venn diagrams aren’t the only templates that help break down the relationship between multiple items. The Euler diagram is one of the Venn diagram’s closest relatives and does many of the same things but with its own unique differences.
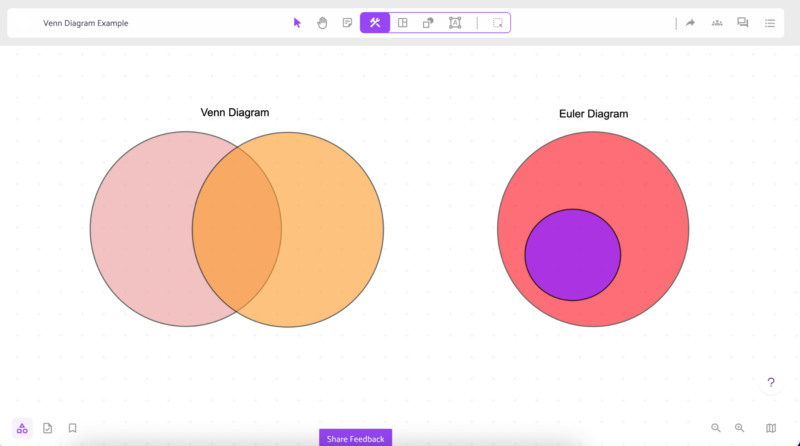
The principal difference between a Venn diagram and an Euler diagram is that Venn diagrams show all possible relations between a set of items while a Euler diagram only shows the actual relations between the same set.
What this means is that Euler diagrams will only show the relevant connections between a set of items in the context that you’re analyzing them, while Venn diagrams will show every connection even if it isn’t relevant to the current analysis. Venn diagrams show overlapping sections even if there are no overlapping criteria, while if there isn’t any overlap that section will not exist in the Euler diagram.
The visualization of Venn and Euler diagrams are also similar yet different, with Euler diagrams having concentric circles while Venn diagrams have overlapping circles. Because of this structure, Euler diagrams are best suited for categories that have long hierarchies or overlap in the majority of their criteria.
While they have their differences, both Venn and Euler diagrams are important templates that help teams understand the comparison between different items and how to break down the nature of their relationships.
9 Examples of Venn Diagram
If you are wondering how these diagrams will operate in different scenarios or contexts, here are some examples of how Venn diagrams can be applied.
1. Triple Venn Diagram
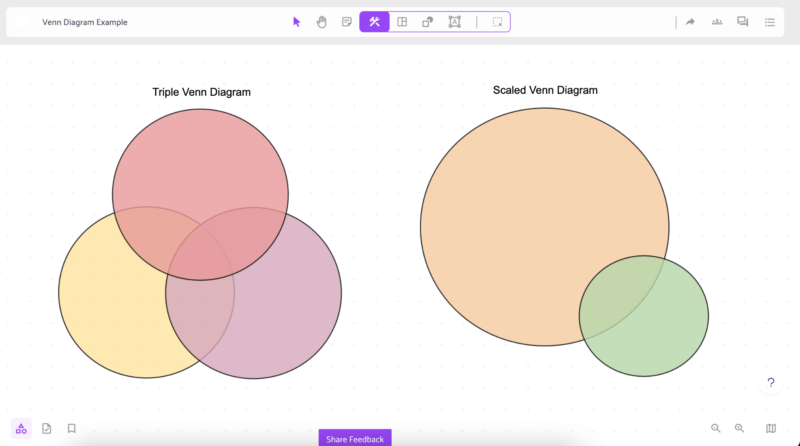
A triple Venn diagram is pretty much a Venn diagram with another circle added, which creates four more intersections to place items. This template is practically identical in use to a traditional Venn diagram but allows you to incorporate an additional element to compare.
While the purpose of adding a triple Venn diagram is ultimately to increase the number of items that can be compared, it is also to point out that you can scale Venn diagrams to an infinite degree. While this isn’t super helpful when you reach a certain point, it goes to show how dynamic Venn diagrams are. Being able to scale your template is an important advantage of using a Venn diagram and shows how applicable they are to many different scenarios.
2. Scaled Venn Diagram
The scaled Venn diagram is also similar to the traditional Venn diagram but adds a layer of importance to the elements being compared. While traditional diagrams maintain a standard size for all of the elements being compared, scaled Venn diagrams have different-sized shapes based on the importance and influence of those elements.
This means that while comparing items you’ll also be able to weigh the importance of the various elements and use this information to aid in your decision making. This is a really important thing to do when mapping stakeholders or product concerns, because while there might be some overlap it’s also important to consider which item maintains priority.
The scaled Venn diagram is also known as the Area Proportional, where the shapes holding the items are proportional to their representation of the whole.
3. Business Applications
Business is one area where Venn diagrams can be extremely useful because in business there are always things to compare and consider when making decisions. This process can become much easier by using a simple comparison template.
Venn diagrams can be used to compare and contrast different products and prototypes, multiple different design iterations, or different approaches to a marketing plan. All of these are examples of how versatile Venn diagrams can be to help businesses compare items and find their path forward. Not only can they help businesses compare different elements, but they increase their ability to communicate effectively about their ideas and come to a reasonable middle ground.
Being able to use an online whiteboard, like IdeaScale Whiteboard, to map out comparisons is hugely important to the success of a business and helps create new solutions in any practice area.
4. Statistics
Statistics and probability are fields that have a close relation to Venn diagrams and are often using these templates to predict the likelihood of certain outcomes. This field is more associated with the mathematical implications that Venn diagrams have and their relation to prime numbers but still can gather important data from the use of these templates.
Venn diagrams can be used to find the relative commonalities, similarities, and differences between diverse data sets. This is an important application in the field of statistics and yet another reason why Venn diagrams have important applications in the professional world.
5. Educational Insights
Imagine a Venn diagram illustrating the similarities and differences between two historical events. This visual aid can help students grasp the nuanced connections, fostering a deeper understanding of historical contexts.
6. Literary Analysis
Use a Venn diagram to compare and contrast characters from different novels. By overlapping circles to represent character traits, readers can visualize the intersections and disparities, facilitating a more comprehensive analysis.
7. Scientific Classifications
Utilize a Venn diagram to categorize and compare different species based on shared and unique characteristics. This visual approach is particularly effective in biology classes, simplifying complex taxonomies.
8. Project Management
When managing projects with overlapping tasks, a Venn diagram can visually depict the dependencies and shared responsibilities between teams. This enhances project coordination and ensures a smooth workflow.
9. Technology Integration
Showcase the integration of technology tools in education with a Venn diagram. Highlight the common features and distinctions between various educational apps, aiding educators in selecting the most suitable tools for their classrooms.
These examples demonstrate the adaptability of Venn diagrams across different disciplines, making them a valuable asset in both educational and professional settings. Whether it’s for academic understanding, literary exploration, strategic planning, scientific analysis, project coordination, or technological integration, Venn diagrams offer a visually intuitive way to explore relationships and highlight key insights.”
Learn more: What is a Fishbone Diagram?
Conclusion
While Venn diagrams can be incredibly simple, that doesn’t stop them from being one of the most effective comparative templates that you can use. Whether you’re auditing your business or teaching a class, Venn diagrams are sure to help improve your comparison and communication skills.
Most Recent Posts
Explore the latest innovation insights and trends with our recent blog posts.


