Table of Contents
If you’ve ever needed to map out information, you’ve likely used either a concept map or a mind map. These structures are good at creating thought models and are relatively basic to use. What happens, then, if you want to create a more complex diagram that explains how an entire process functions? In this scenario, you’d most likely be pointed towards a UML diagram. This article will define UML diagrams and walk through how you can best use them.
What is a UML Diagram?
The UML diagram, grounded in the Unified Modeling Language (UML), is defined as a dynamic template facilitating the visualization of processes and sequences. This visual representation meticulously captures a system’s essential elements, including actors, roles, actions, and artifacts.
With a primary goal of not only enhancing understanding but also facilitating seamless alterations, maintenance, and comprehensive documentation of crucial system information, UML diagrams stand as an indispensable tool in modern software design and development.
UML was not always a thing, but its creation resulted from the chaos around software development and documentation in the late 1990s. There were many ways to describe and represent existing software systems. Because of this confusion, there was a need to develop a better way of visualizing those systems.
As a result, three software engineers at Rational Software developed the UML between 1994 and 1996. In 1997, it was adopted as the standard documenting language for visualizing a software program.
UML Diagram Use Cases
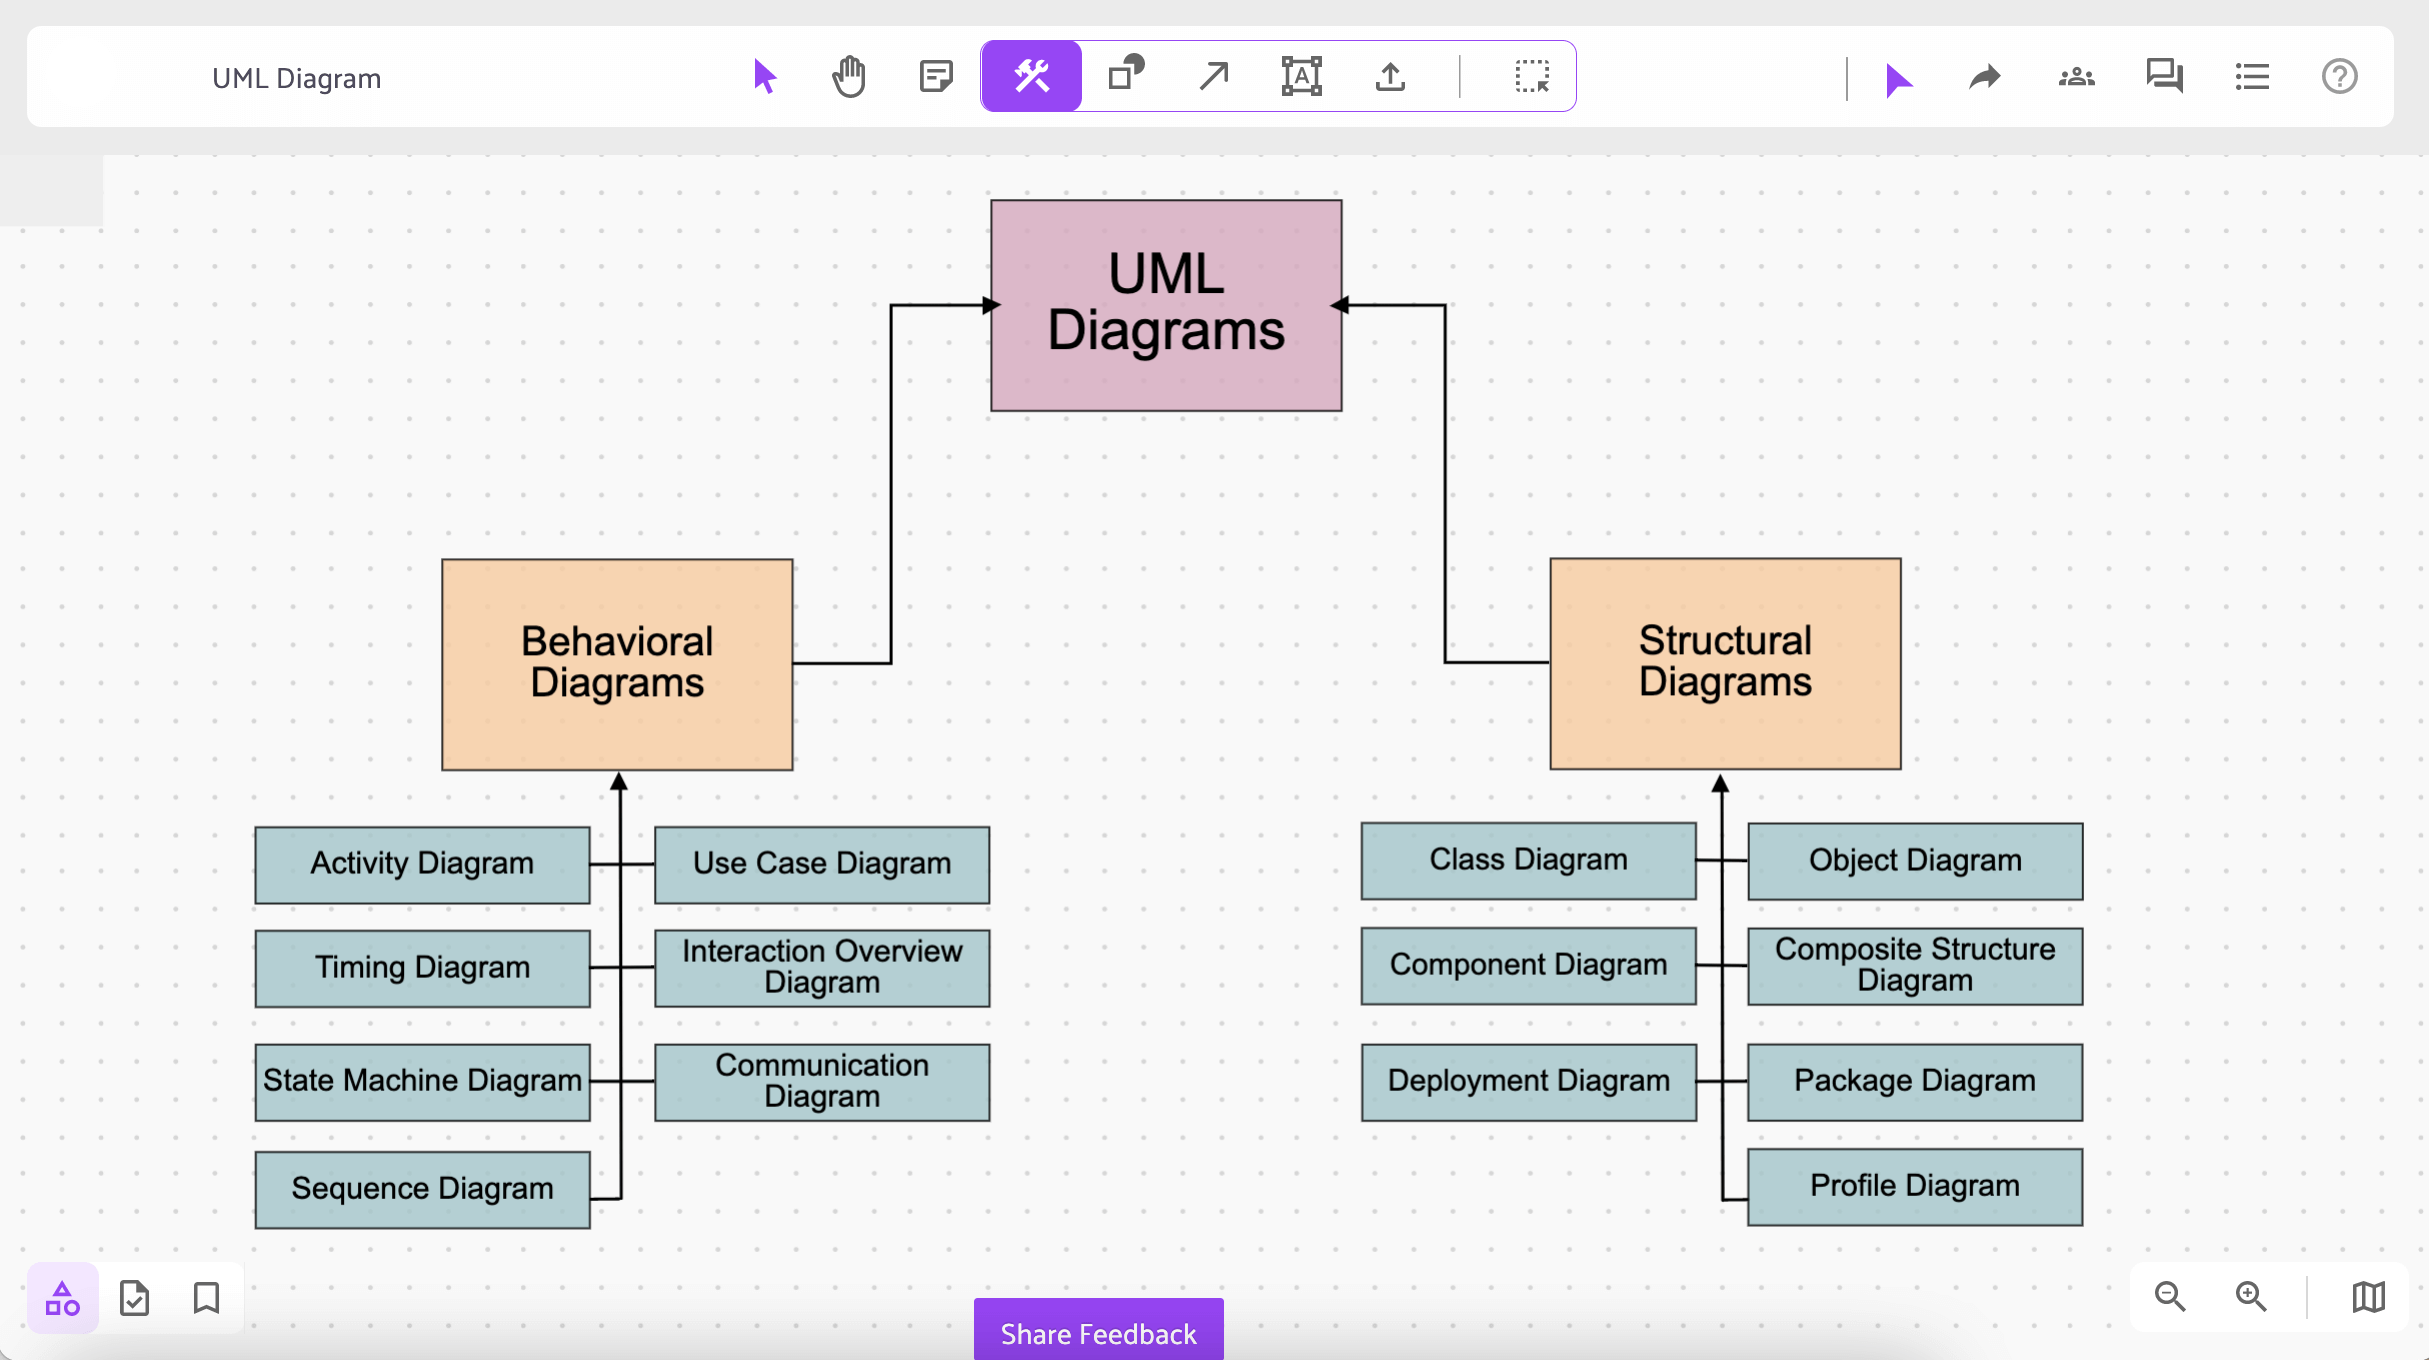
Unified Modeling Language (UML) diagrams have become the backbone of modern software development, offering a visual language to express and communicate intricate system structures. Among the diverse arsenal of UML diagrams, each tailored to specific needs, exploring their use cases unveils a world of possibilities for software architects and developers.
1. Structural Clarity with Class Diagrams
At the heart of UML lies the Class Diagram, a powerful tool for depicting the static structure of a system. Use it to define classes, their attributes, and relationships, providing a blueprint that fosters a shared understanding among development teams. Class diagrams are invaluable during the early stages of a project, offering a bird’s-eye view of the system’s architecture.
2. Navigating Dynamic Processes with Sequence Diagrams
When it comes to understanding the flow of operations over time, Sequence Diagrams shine. These diagrams illustrate the interactions between objects in a sequential manner, offering insights into the dynamic behavior of a system. Ideal for identifying bottlenecks, dependencies, and ensuring smooth collaboration among different components.
3. State Your Intentions with Statechart Diagrams
Software systems are dynamic entities, transitioning between states in response to external stimuli. Statechart Diagrams provide a visual representation of these states, transitions, and events, making it an indispensable tool for modeling the behavior of systems with complex state-dependent logic.
4. Mapping Out Activities with Activity Diagrams
For a detailed view of workflows and business processes, Activity Diagrams come to the forefront. These diagrams break down activities into a series of actions and decisions, helping to streamline processes and identify areas for optimization. Ideal for business analysts and developers collaborating to ensure seamless execution of tasks.
5. Bringing Components Together with Component Diagrams
In the world of software architecture, understanding the relationships between different components is key. Component Diagrams provide a holistic view of the physical structure of a system, showing how components interact and collaborate to achieve overarching system goals.
6. Building Relationships with Use Case Diagrams
When it comes to understanding system functionalities from an end-user perspective, Use Case Diagrams are the go-to choice. These diagrams depict the interactions between actors and use cases, offering a clear roadmap for system behavior and functionality.
The diverse array of UML diagrams caters to the multifaceted nature of software development. By strategically employing these diagrams based on specific use cases, developers can foster clear communication, streamline processes, and ensure the success of their projects. Dive into the world of UML diagrams and witness how these visual representations elevate your software development endeavors.
Learn more: Types of UML Diagram
How to Make a UML Diagram
Creating a UML diagram involves several steps, from planning and identifying the elements to drawing the diagram using UML diagram tools. Here’s a general guide on how to make a UML diagram:
- Identify the Purpose and Scope: Determine why you need the UML diagram and what it should represent. Are you modeling a system, a process, or a specific aspect of a system? Define the scope of the diagram.
- Select the Appropriate UML Diagram Type: Choose the type of UML diagram that best fits your needs. The choice depends on what aspect of your project you want to model. Common types include use case diagrams, class diagrams, sequence diagrams, and more.
- Identify the Elements: Identify the main elements that you want to include in your diagram. For example, if creating a class diagram, you’ll need to identify the classes, attributes, methods, and relationships.
- Define Relationships: Determine how the elements are related to each other. In UML, relationships like associations, generalizations, dependencies, and aggregations are used to represent connections between elements.
- Start Drawing the Diagram: You can use various tools for creating UML diagrams, such as drawing software, UML modeling tools, or even pen and paper. Here are the steps for drawing the diagram:
a. For digital tools, open the UML diagram software or tool of your choice. Many UML modeling tools offer templates for different UML diagram types.
b. Begin by creating the main elements of the diagram. For example, in a class diagram, create class boxes with their attributes and methods.
c. Add lines and connectors to represent the relationships between the elements. You can use different arrowheads and line styles to indicate the type of relationship.
d. Label the elements and relationships to provide additional information.
e. Use proper notations and conventions as per UML standards.
- Review and Refine: Following the generation of the initial diagram, it is crucial to conduct a thorough assessment to ensure its precision and comprehensiveness. Make any necessary adjustments or refinements to ensure it accurately represents the system or process you’re modeling.
- Document: UML diagrams should be accompanied by documentation that explains the purpose of the diagram, the meaning of symbols, and any important notes about the elements and relationships.
- Share and Collaborate: If you are working with a team, share the UML diagram and documentation with team members to ensure a common understanding.
- Keep It Updated: As your project evolves, make sure to update your UML diagrams to reflect any changes in the system or process.
- Save and Export: Save your UML diagram in an appropriate format and export it if you need to share it with others.
Remember that UML diagrams are a tool for communication and visualization, so clarity and consistency in their design and documentation are essential. The choice of UML diagram type and level of detail will depend on the specific needs of your project.
Learn more: UML Diagram Advantages
Conclusion
Over the past few years, UML diagrams have become a much more powerful tool for documenting various business processes or workflows. Initially, only software developers and professionals from the IT sector used UML, but nowadays, many people use UML diagrams in their daily work and have adopted them across different industries. If you liked this article and want to learn more about IdeaScale Whiteboard, stay tuned to our blog to learn more.
Most Recent Posts
Explore the latest innovation insights and trends with our recent blog posts.


