Reporting and Analytics
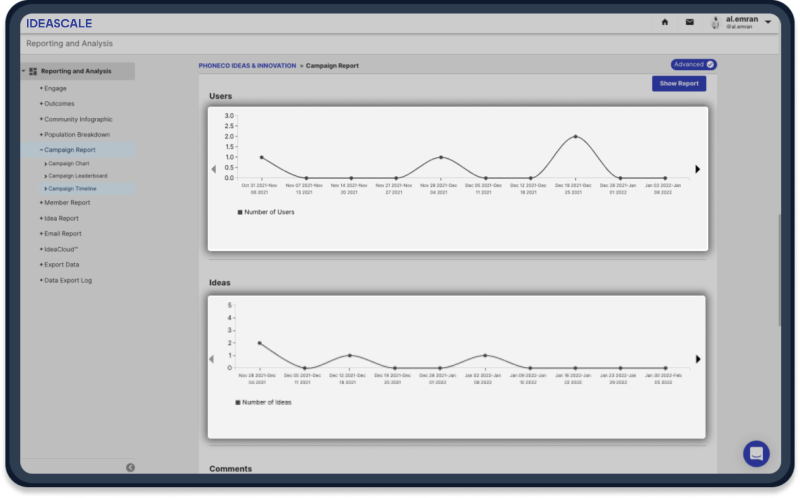
Gain visibility into your innovation inputs and outputs by understanding what ideas are coming from where and how many ideas you’ve implemented and their relative value by viewing your organization-wide innovation dashboards.

Power BI and Tableau Integration
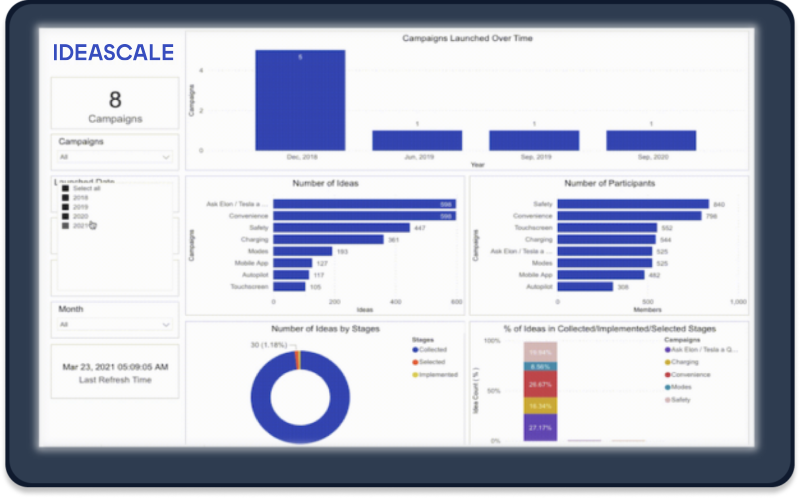
Visualize and customize IdeaScale data in PowerBI or Tableau dashboards.

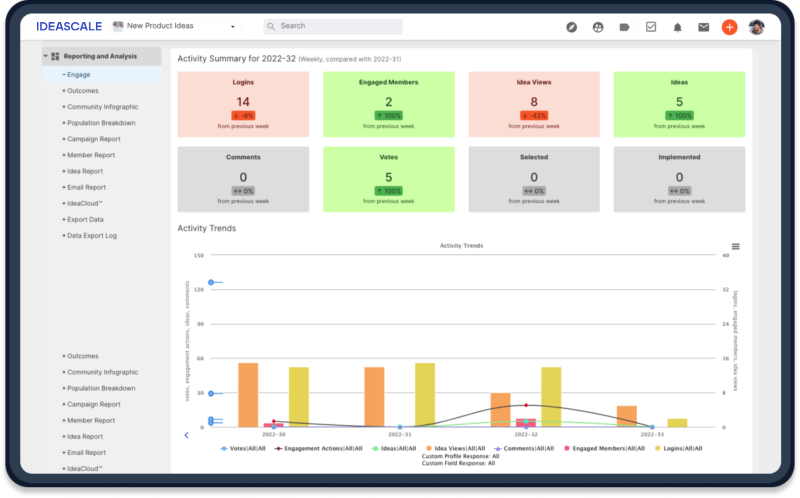
Activity Trends
Easily respond to every idea and increase engagement from the moderation dashboard. Respond to ideas, link and merge ideas, invite others to the conversation, and more.
