What is a Cause and Effect Diagram?
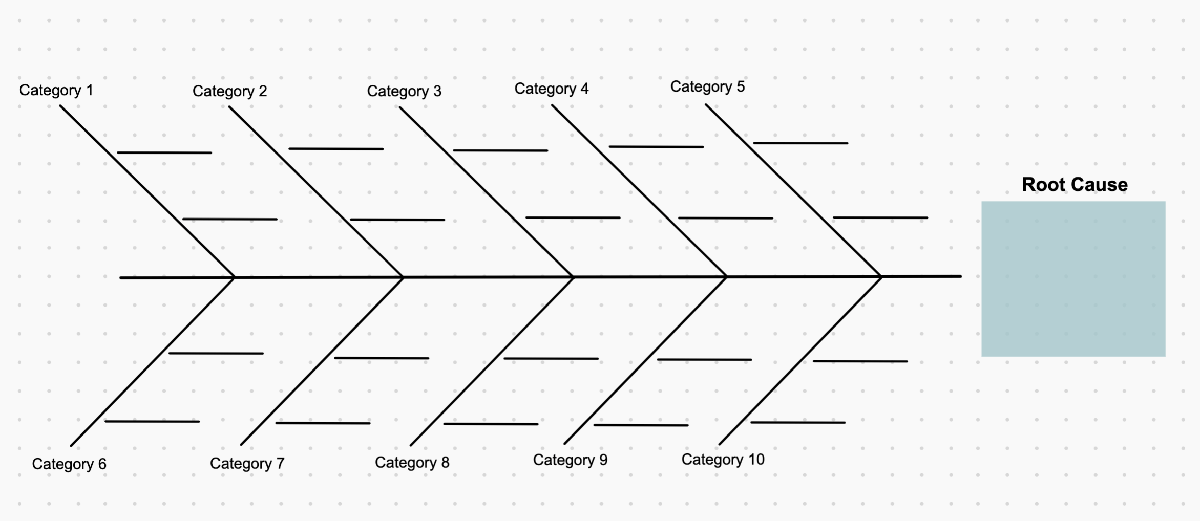
A Cause and Effect Diagram, also known as a Fishbone Diagram or Ishikawa Diagram, is defined as a visual tool used to identify and organize potential causes of a specific problem or effect. It helps teams systematically analyze the root causes of an issue by visually representing the various factors that may contribute to it.
The diagram is called a “Fishbone Diagram” because of its appearance, resembling the skeleton of a fish with the problem or effect at the head and the potential causes branching off like fishbones.
Key components of a Cause and Effect Diagram include:
- Problem or Effect: At the head of the diagram, the problem or effect being analyzed is clearly stated. This could be a specific issue, symptom, or outcome that the team wants to understand and address.
- Major Categories or Causes: The main branches of the diagram represent major categories or factors that could contribute to the problem. These categories are typically identified based on common themes or areas of concern related to the problem being analyzed. Common categories include people, processes, equipment, environment, and materials.
- Sub-Causes or Factors: Each major category is further broken down into sub-causes or factors that may contribute to the problem. These are represented as smaller branches stemming from the main branches. The sub-causes represent specific aspects or elements within each category that could potentially influence the problem.
- Analysis and Discussion: Once the diagram is completed, the team engages in analysis and discussion to identify potential causes and relationships between them. They consider factors such as frequency, impact, and interdependencies to determine which causes are most likely to be contributing to the problem.
- Action Planning: Based on the analysis, the team identifies potential solutions or corrective actions to address the root causes identified in the diagram. These actions may target specific causes or address broader issues within the organization or process.
The Cause and Effect Diagram is a versatile tool that can be used in various problem-solving and improvement initiatives, including quality management, process improvement, root cause analysis, and project management. It encourages collaboration, brainstorming, and structured analysis, enabling teams to gain deeper insights into complex problems and develop effective solutions.
3 Examples of Cause and Effect Diagram
Here are a few examples of Cause and Effect Diagrams in different contexts:
1. Manufacturing Defects:
- Problem: Defects in manufactured products.
- Major Categories: Materials, Methods, Machinery, Manpower, Measurement, Environment.
- Sub-Causes or Factors: For each major category:
- Materials: Poor quality raw materials, incorrect material specifications.
- Methods: Inadequate manufacturing processes, lack of standard operating procedures.
- Machinery: Equipment malfunctions, insufficient maintenance.
- Manpower: Lack of training, human error.
- Measurement: Inaccurate measurement tools, inconsistent measurement techniques.
- Environment: Temperature variations, humidity levels.
- Analysis and Discussion: Team members analyze potential causes within each category and identify root causes contributing to defects, such as equipment malfunctions or insufficient training.
2. Customer Complaints in a Service Industry:
- Problem: High number of customer complaints.
- Major Categories: People, Processes, Policies, Procedures, Physical Evidence, Product/Service Quality.
- Sub-Causes or Factors: For each major category:
- People: Inadequate training, poor communication skills.
- Processes: Inefficient service delivery processes, lack of standardized procedures.
- Policies: Unclear or outdated policies, restrictive policies.
- Procedures: Ambiguous procedures, procedural bottlenecks.
- Physical Evidence: Poor facility maintenance, inadequate facilities.
- Product/Service Quality: Defective products, inconsistent service quality.
- Analysis and Discussion: Team members explore potential causes within each category and identify opportunities for improvement, such as enhancing training programs or streamlining service processes.
3. Project Delays:
- Problem: Delays in completing project milestones.
- Major Categories: People, Processes, Resources, Requirements, Risks.
- Sub-Causes or Factors: For each major category:
- People: Lack of skills or expertise, team member turnover.
- Processes: Inefficient project management practices, scope creep.
- Resources: Insufficient budget, equipment shortages.
- Requirements: Unclear project requirements, changing client needs.
- Risks: Unforeseen risks, inadequate risk management.
- Analysis and Discussion: Team members identify potential causes within each category and develop strategies to mitigate risks and streamline project processes.
These examples demonstrate how Cause and Effect Diagrams can be used to systematically analyze complex problems, identify root causes, and develop effective solutions across various industries and domains.
Cause and Effect Diagram Benefits
Cause and Effect Diagrams offer several benefits for problem-solving, analysis, and decision-making processes within organizations:
- Structured Analysis: Cause and Effect Diagrams provide a structured framework for analyzing complex problems by breaking them down into manageable components. By categorizing potential causes into major categories and sub-causes, teams can systematically explore and understand the various factors contributing to the problem.
- Visual Representation: The visual nature of Cause and Effect Diagrams makes it easier for teams to understand and communicate the relationships between different causes and the problem or effect being analyzed. The diagram provides a clear and concise representation of the cause-and-effect relationships, enhancing clarity and facilitating collaboration among team members.
- Brainstorming Tool: Cause and Effect Diagrams serve as effective brainstorming tools for generating ideas and hypotheses about potential causes of a problem. Teams can use the diagram to capture and organize insights from diverse perspectives, stimulating creative thinking and exploration of different possibilities.
- Identification of Root Causes: By systematically analyzing potential causes within each category, Cause and Effect Diagrams help teams identify root causes—the underlying factors that contribute most significantly to the problem. This enables teams to focus their efforts on addressing the root causes rather than merely addressing symptoms or superficial issues.
- Problem-Solving Facilitation: Cause and Effect Diagrams facilitate problem-solving discussions and decision-making processes within teams. They provide a visual framework for structuring discussions, guiding analysis, and prioritizing actions, fostering consensus-building and alignment among team members.
- Prevention of Recurrence: By identifying and addressing root causes, Cause and Effect Diagrams help organizations prevent the recurrence of problems in the future. By implementing corrective actions targeted at addressing underlying issues, organizations can improve processes, systems, and practices to enhance overall performance and reliability.
- Continuous Improvement: Cause and Effect Diagrams support a culture of continuous improvement by enabling organizations to systematically identify and address problems and inefficiencies. By regularly using Cause and Effect Diagrams as part of problem-solving and root cause analysis initiatives, organizations can drive ongoing improvements in quality, efficiency, and effectiveness.
- Cross-Functional Collaboration: Cause and Effect Diagrams encourage cross-functional collaboration by involving stakeholders from different departments or areas of expertise in problem-solving efforts. By bringing together diverse perspectives and knowledge, teams can gain a comprehensive understanding of the problem and develop holistic solutions that address multiple facets of the issue.
Overall, Cause and Effect Diagrams serve as valuable tools for problem-solving, analysis, and decision-making processes within organizations, helping teams identify root causes, develop effective solutions, and drive continuous improvement.
10 Problem-Solving Cause and Effect Diagram Analysis
Cause and Effect Diagram Analysis involves systematically examining the potential causes of a problem or effect depicted in a Cause and Effect Diagram (also known as a Fishbone Diagram or Ishikawa Diagram). Here’s a step-by-step guide to conducting Cause and Effect Diagram Analysis:
- Review the Diagram:
Start by reviewing the completed Cause and Effect Diagram, focusing on the problem or effect identified at the head of the diagram and the major categories and sub-causes branching off from it.
- Identify Potential Causes:
Examine each major category and its corresponding sub-causes to identify potential factors that may contribute to the problem or effect being analyzed. Consider both internal and external factors that could influence the outcome.
- Prioritize Causes:
Prioritize potential causes based on their relevance, likelihood, and impact on the problem or effect. Focus on identifying root causes—the underlying factors that contribute most significantly to the problem—rather than superficial or secondary causes.
- Analyze Relationships:
Analyze the relationships between different causes and the problem or effect. Consider how each cause may interact with or influence other causes, leading to the observed outcome. Look for patterns, dependencies, and correlations among the identified causes.
- Probe Deeper:
For each potential cause, probe deeper to understand the underlying mechanisms or reasons behind it. Ask “why” multiple times to uncover the root cause behind each identified factor. This iterative process of asking “why” helps trace the causal chain back to its source.
- Gather Data:
Gather relevant data and evidence to support or refute each potential cause identified in the diagram. Use data analysis techniques such as statistical analysis, trend analysis, or root cause analysis tools to validate assumptions and hypotheses.
- Verify Assumptions:
Verify assumptions and hypotheses about potential causes through observation, experimentation, or consultation with subject matter experts. Test hypotheses and gather feedback to confirm or revise your understanding of the causal relationships.
- Document Findings:
Document the findings of the analysis, including the identified causes, their relationships, and the evidence supporting each cause. Summarize the key insights and conclusions drawn from the analysis, highlighting the most significant root causes and their implications.
- Develop Action Plan:
Based on the analysis, develop an action plan to address the root causes identified in the diagram. Identify specific actions, initiatives, or interventions aimed at mitigating or eliminating the root causes and improving the situation. Delegate responsibilities, define timelines, and establish metrics for monitoring progress.
- Iterate and Improve:
Continuously monitor the effectiveness of the action plan and adjust strategies as needed. Iterate the Cause and Effect Diagram analysis process to incorporate new insights, feedback, and lessons learned over time. Strive for continuous improvement by addressing underlying issues and preventing recurrence of the problem.
Most Recent Posts
Explore the latest innovation insights and trends with our recent blog posts.


