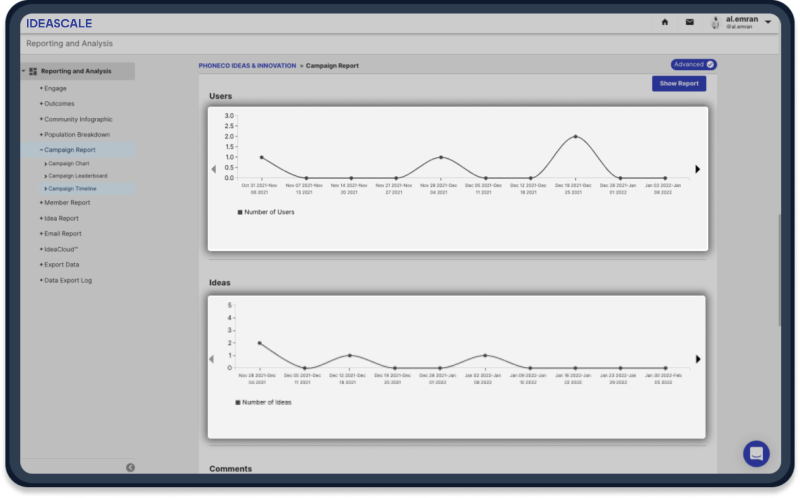
レポートと分析
組織全体のイノベーション・ダッシュボードを見ることで、どこからどのようなアイデアが生まれているのか、どれだけのアイデアを実施したのか、またそれらの相対的な価値を理解することで、イノベーションのインプットとアウトプットを可視化することができます。

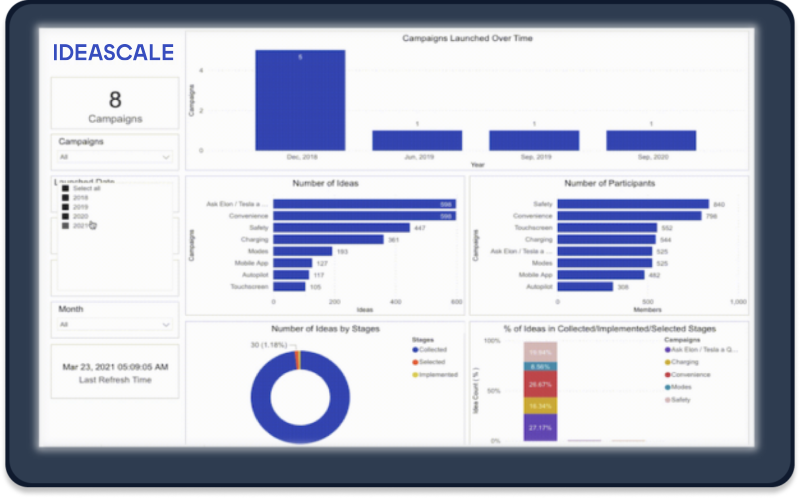
Power BIとTableauの統合
PowerBI または Tableau ダッシュボードで IdeaScale データを視覚化およびカスタマイズ。

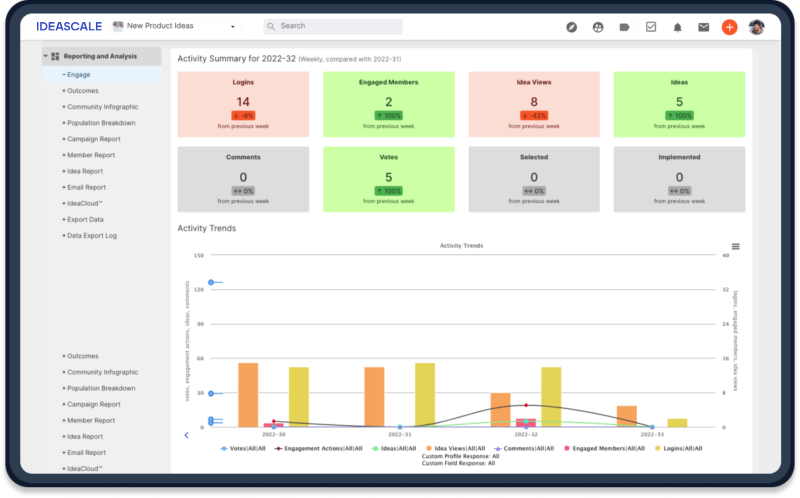
活動動向
モデレーションダッシュボードから、すべてのアイデアに簡単に対応し、エンゲージメントを高めることができます。 アイデアへの返信、アイデアのリンクやマージ、会話への招待など。
